
Abstract
Does bubble rating has positive causal inpact on increasing views of postings for hotels in Tripadvisor? Is it actually beneficial to the business?
Github repo: 🔗Link
Background
- Many of platform services, including Tripadvisor utilize ‘Bubble Rating’ system, in which represent numerical rating into ‘5 Stars’ (or bubble) scale.
- Since bubble rating system represent scores in unit of 0.5 bubble (e.g. 0.5 stars, or 1 complete stars) most of the services rounds up actual numerical ratings into closest 0.5 unit.
Questions
- However, in some perspective bubble rating could sometimes seen as distorting actual data, and could be deceptive to the customers. It may boost up views of postings which are rounded up, but it might harm performance of postings in which their socres are rounded down.
- Also, in terms of business operations, it is very important to quantitatively measure size and direction of impact caused by bubble rating policy.
Methodology
- This project go through Regression Discontinuity Analysis (paratetric approach), setting rating roundup as cutoffs.
- Due to high sparsity and variance of the dataset, this study aggregated hotels with 0.05 score bin, under assumption that in-group variance of hotels with close rating are not high.
- Since limited sample size under aggregated datapoint, our project took advantage of parametric RDD instead of non-parametric RDD, regressing over entire range of data instead of setting bandwidth.
Analytical Result Summary
- People starts to perceive rating ‘high’ form 4.0. In 3.5 or lower rating, people are less likely to perceive hotel to be ‘better’ even though score increases.
- Between 4.0~4.5, hotel are less differentiated by the rating. Customers might feel 4.0, or 4.2 as equally ‘good’ as 4.4, or 4.5.
- People are more likely to click hotels with 4.5 rating with a lot of reviews, than 4.75+ rating with few reviews. Customers are actually more sensitive to rating count when the rating is higher.
Some Details
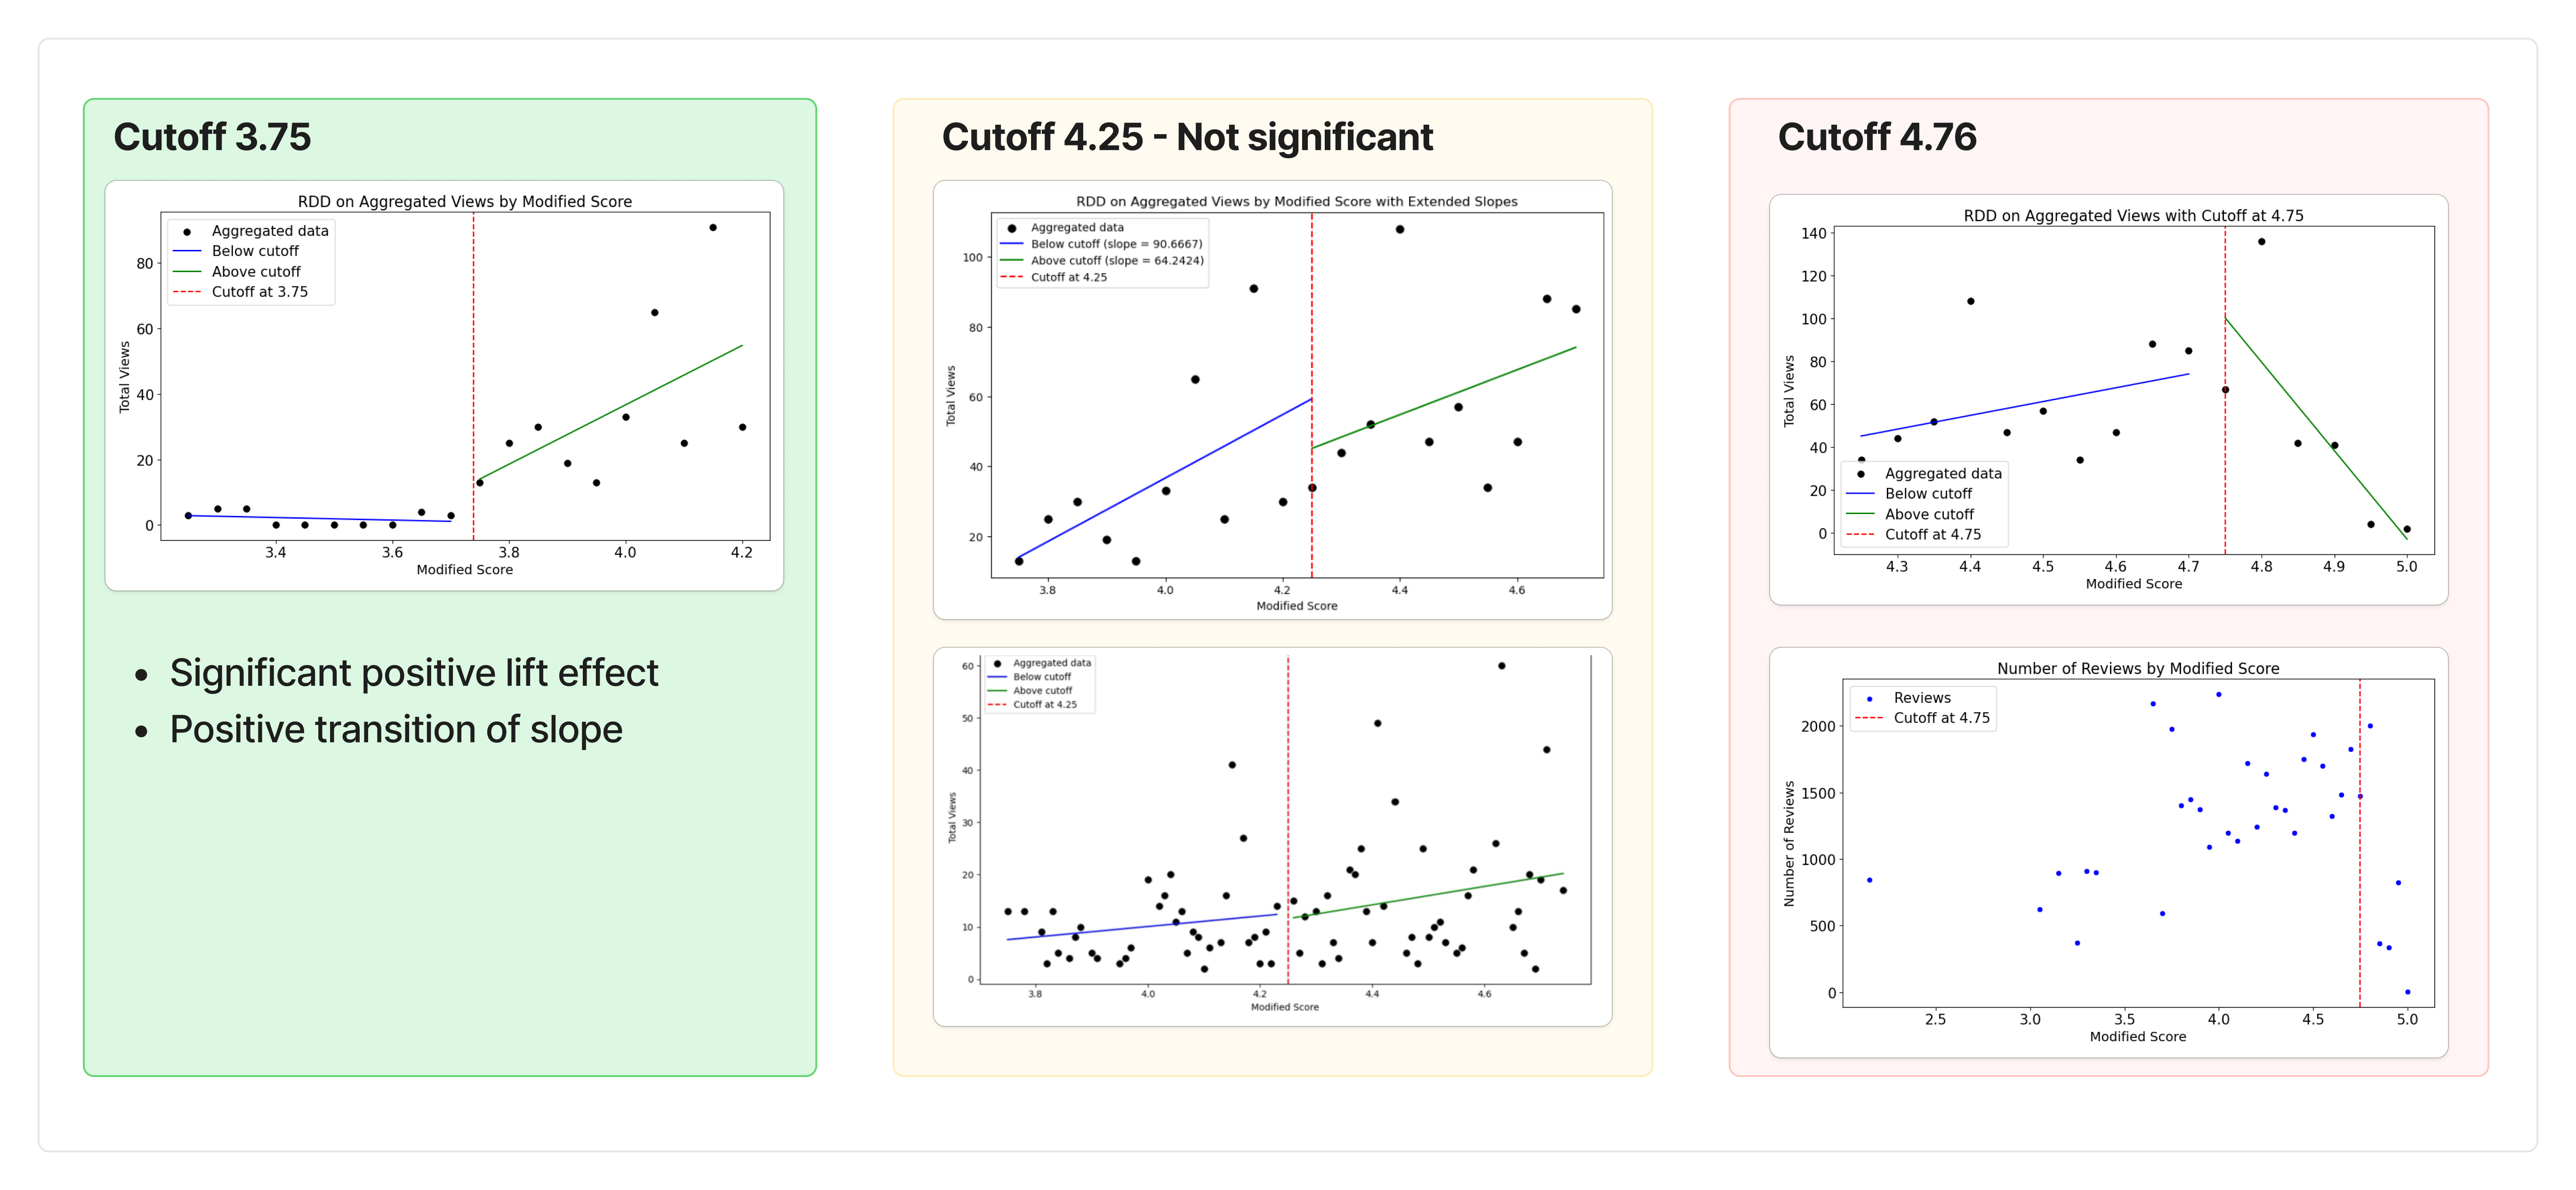
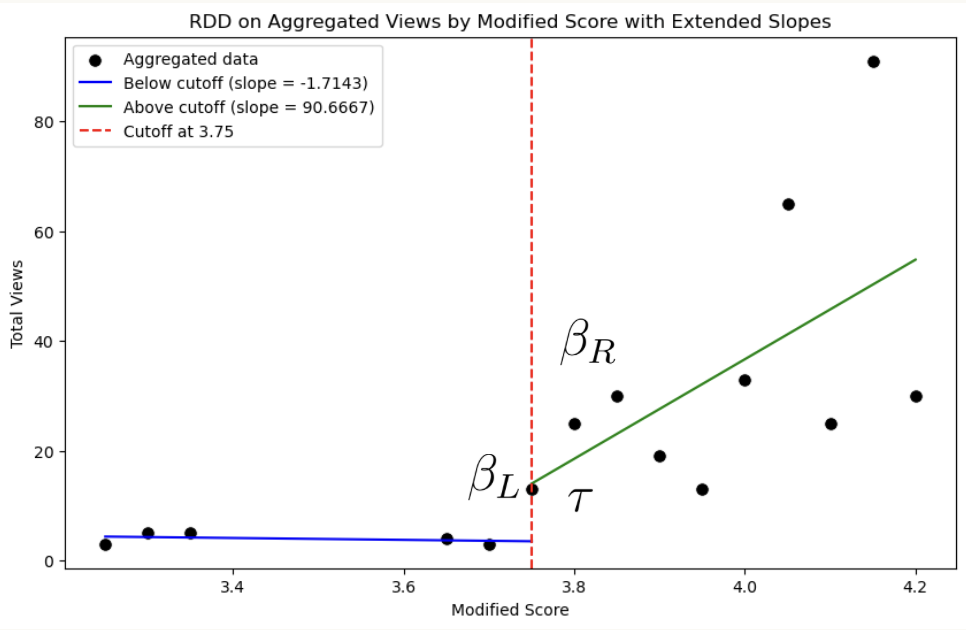
- Custoff 3.75: Significant positive effect on lifting views (clicks) & Positive transition of slope
- Implying customer are more sensitively responding to the rating after the cutoff
- Customers perceive score difference before and after 3.75 to be significant.
- Cutoff 4.25: Both positive effect & slope change was not significant
- Customers does not perceive score differences around 4.25 to be significant.
- Cutoff 4.75: Positive effect on lifting view. However, after cutoff increase in rating cause drop in clicks (views), which is couterintuitive.
- Through further analysis, we figured out the trop is due to externality, which is drop in number of reviews.
- This imply people are likley to doubt credibility of rating, if rating is very high while number of rating is very low. (e.g. 4.9 or 5.0 rating with only 10 reviews)
Research Question and Hypothesis
When we are booking hotels through platform as Tripadvisor, we usually focus on 2 things - price, and rating. Decision process of most customers would be:
- Set target price range based on the budget.
- Within the budget, compare ratings.
This implies assuming that all other variabled are controlled as much as possible (such as, price, location, etc) rating will have significant impact on ‘clicks (views)’ of the hotel listing. Which means, \(\text{For: Clicks (views)} = \beta_0 + \beta_1\text{Rating} + \sum_{i=1}^n\beta_i \cdot x_i, \quad \beta_1 > 0\) Where x are all the omitted variables, which both related to rating, and clicks.
The ‘Bubble Rating System’ represents raw scores ranging from 0.0 ~ 5.0 into 5 bubble scale with minimum unit of 0.5 (half bubble), therefore it rounds up / down raw score to the closest .5 or .0, having every 0.25 and 0.75 as cutoffs. Recognizing positive causal relationship between rating and views, we could assume that if we ‘round up’ scores, views of the posting will be lifted up compared to what it supposed to be.
Considering the business revenue model of platforms like Tripadvisor, higher ‘views’ are highly likely tyo have positive network effect on revenue, because:
- Higher view will lead to higher transaction, since transaction will be $\text{Views} \times \text{Conversion rate}$
- Higher view will bring higher ad-related revenue.
However, it is important to quantitaively measure effect of bubble rating policy to check if it is actually benefiting business. Rounding up important information as ETA, or rating on platform service might put some risk on customer experience, because it will anyway distort the information to some extent. Also, sensitivity of customers on the rating might vary for different range of ratings.
Therefore, through this research we will measure:
- Measure how much is the lift effect on views is brought by rounding-up policy.
- Observe how people react differently before and after the cutoff on the rating.
In conclusion, we will bring up suggestion for the best business actions and strategies we could make based on the RDD analysis.
Data processing and some assumptions.
The problem of the raw Tripadvisor rating dataset was 1) High variance of the data, and 2) A lot of ‘0’, or very small number of view postings. Causal relationship between rating and view could be measured under fully controlled environment - all the other features of posting should be equal other than the ‘rating’. However, in platform environment all hotel listing are not listed in equal context. Number of hotels customers view are limited, and therefore a lot of hotels are not having enough exposure to the users.
Therefore, this project go through data processing to issue 2 major issues.
- We will only look into cutoff above 3.5 ratings - Since most of the listing & filtering logic prioritize rating, people are less likely to be exposed with low rating hotels - we observe majority of hotles under 3.5 rating have 0 or close to 0 views.
- Aggregate hotels by binning to the closest 0.05 rating – To reduce noise and enhance visibility of the underlying patterns, we average hotels with very similar ratings (within 0.05). At first glance, this may appear to conflict with the RDD assumption, which expects low variance in outcomes for units near the cutoff. However, in our context, we believe the high variability in the raw data is not due to inherent randomness, but rather due to exposure inequality—some hotels receive significantly fewer views due to how the platform surfaces listings. To address this, we carefully chose a small bin size (0.05) to smooth the data just enough without distorting potential discontinuities.
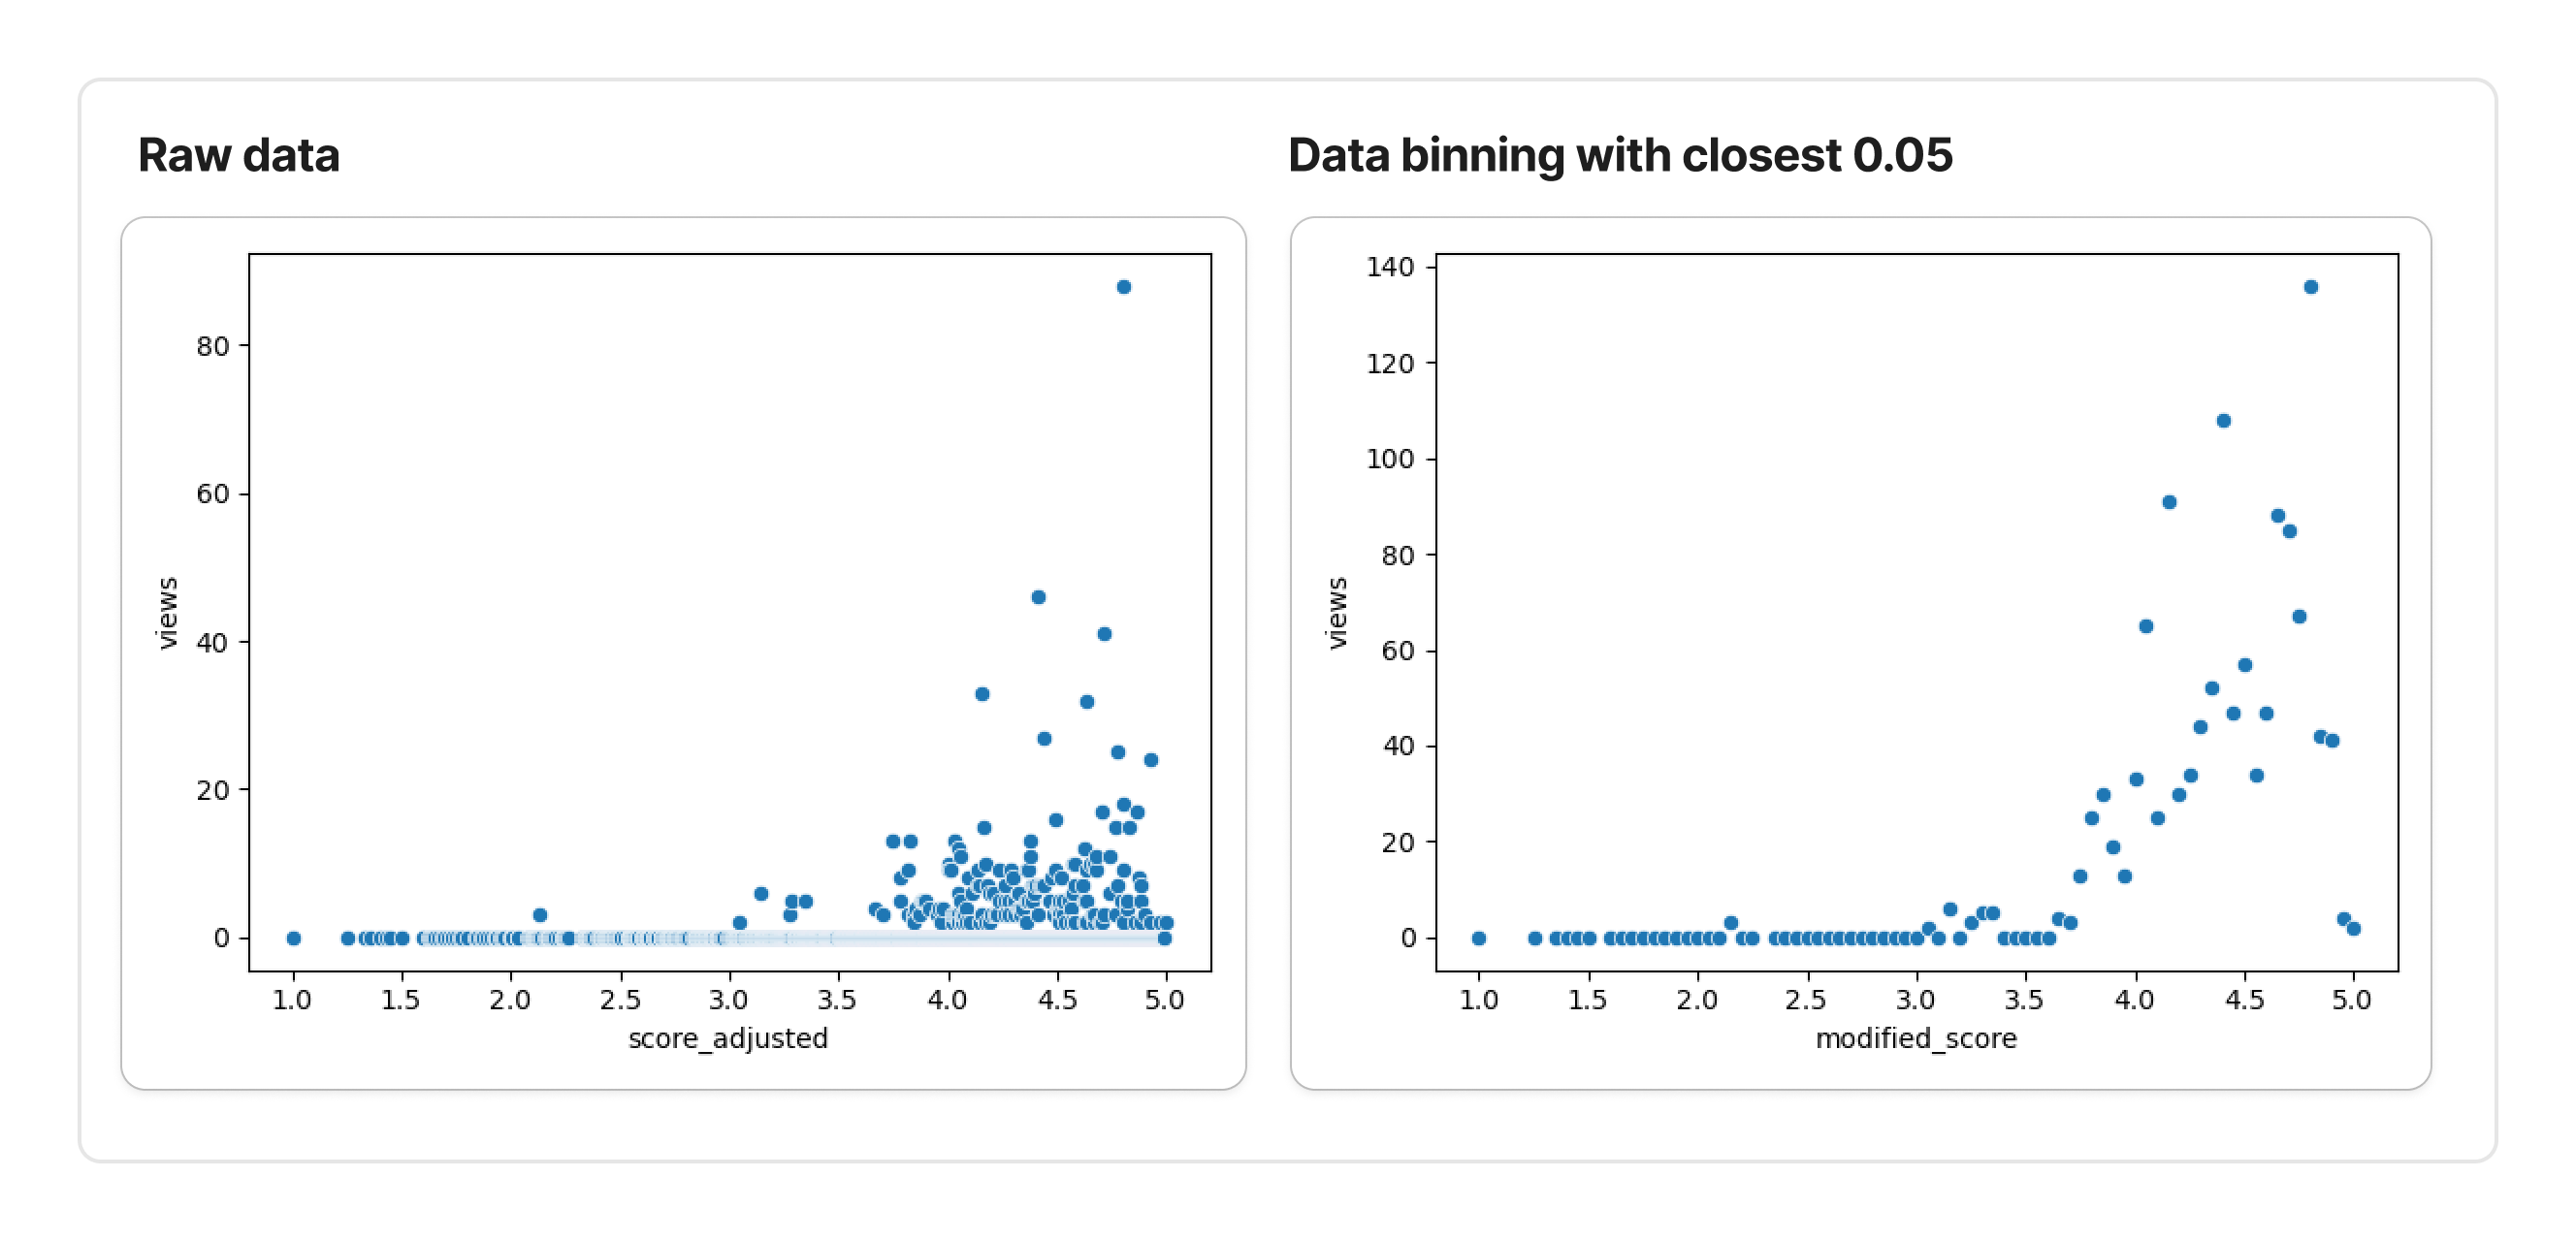
From the figure above, we could see that after binning the data noise has been reduced.
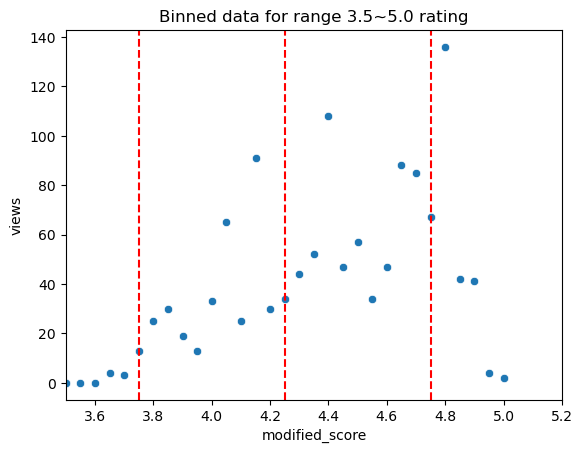
By cutting off range of the only from 3.5 to 4.0, we could more clearly see that patterns of discontinuity at bubble rating cutoffs (3.75, 4.25, 4.75).
Methodology - Parametric RDD analysis
Regression Discontinuity Design is a methodology to measure causal effect of treatment over the cutoff of the ‘running variable’. Without treatment, we assume that dependent variable (e.g. views, or clicks) should have steady or continuous patterns over running variable - for our case, views increase continuously over the rating. However, if the treatment intervenes in certain cutoff, or threshold, it will change the amount of effect (treatment effect - the ‘lift’), and ‘sensitivity’ of running variable’s impact on dependent varuable, which is $\frac{dy}{dx}$. This could be formulated as: \(y = \beta_0 + \beta_1 \cdot \text{Treatment} + \beta_2 \cdot (x-c) + \beta_3 \cdot \text{Treatment} \cdot (x - c) + \epsilon\) Where $c$ is cutoff. From the example RDD plot below, we could measure the following with the coefficients from the regression above:
| Measure | Interpretation | |
|---|---|---|
| $\beta_R$ | $\beta_2 + \beta_3$ | Slope after treatment: sensitivity of views on rating after treatment. |
| $\beta_L$ | $\beta_2$ | Slope before treatment: sensitivity of views on rating before treatment. s |
| $\tau$ | $\beta_1$ | Treatment effect on the cutoff |
In this project, we utilized parametric RDD which takes entire range of the data before and after the cutoff, to run regression. Non-parametric RDD is usually more recommended because of the following 2 advantages:
- Non-parametric does not assume linear relationship of entire dataset - Since non-parametric RDD only run regression taking local bandwidth around the cutoff, it is less prone to the distortion of true relationship of dataset.
- More focused on treatment around cutoffs - Main focus of RDD is measurin treatment effect around cutoff. Therefore, taking non-parametric RDD with local bandwith more focus on measurement of relationship around the cutoff.
However, parametric RDD is better at giving explanation for wider range of running variable. Since our dataset does seem to have simpler linear relationship, and through binning data we lack data points to run non=parametric RDD, we take advantage of parametric RDD.
Results and conclusion
We could get following conclusion through running RDD analysis.
| Cutoff 3.75 | Cutoff 4.25 | Cutoff 4.75 | |
|---|---|---|---|
| Treatment effect | High and Positive | Not significant | High and Positive |
| Slope change | Positively Increased | No significant change | Turned negative from positive |
From cutoff 3.75, through rounding up scores to 4.0 we could see significant jump on views. Also, we could observe before score 3.75 slope was flat, but it became highly positive after the cutoff. This implies 4.0+ is the range of rating that people begins to perceive score to be high, and important. At the same time, score between range of 3.5~3.75 is being rounded down to 3.5. Customers perceive score 3.5 or lower to be low, probably impy low quality. Therefore undre score 3.5, hotels are less likely to get more views even rating increases.
From cutoff 4.25, roundup effect seems to be insignificant. Both slope change, and treatment effect was measured to be minimal. This implies from 4.0~4.5, in terms of customer perspective hotels are less differentiated by rating. 4.0, or 4.2 are treated almost equally good as 4.4, or 4.5.
After cutoff 4.75, we could see positive treatment effect, but interestingly slope turned negative. This implies in high-rating range, people are more less likely to view hotels if rating is high.
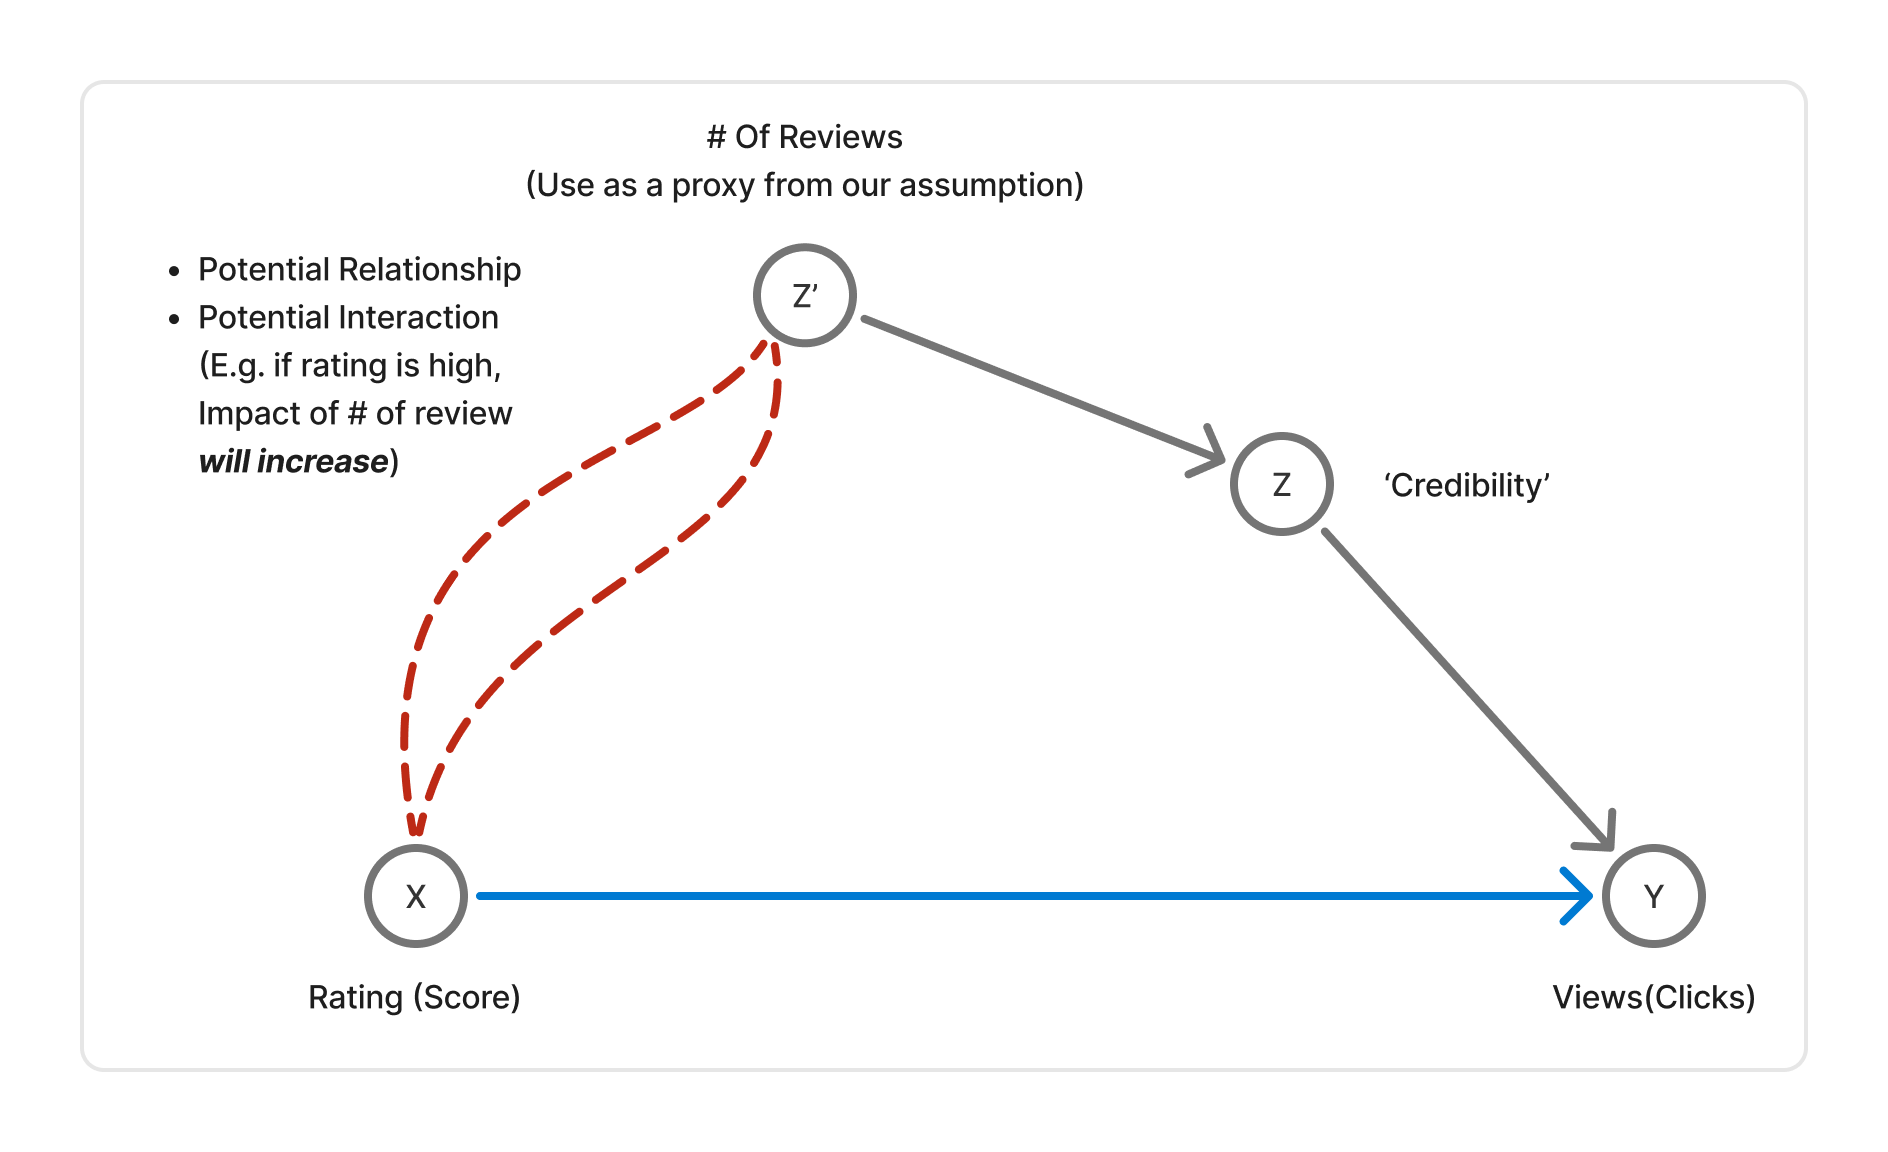
Sensitivity on ‘rating counts’ - Interaction term regression.
Since the results on high rating range is counterintuitive, we made an hypothesis that this could be an omitted variable which effect on the views - rating count. When we usually see very high rating with little number of reviews, we tend to doubt the credibility of the rating.
Therefore, we made an hypothesis that number of reviews are working as an proxy for ‘credibility’, and credibility effects on the views. Also, since we spotted negative relationship between rating and views only in higher rating range, we assumed impact of ‘review count’ on views increases as rating increase. Therefore, we went throug regression by adding interaction term between rating and number of reviews: \(\text{Views} = \beta_0 + \beta_1 \cdot \text{Rating} + \beta_2 \cdot \text{Review Count} + \beta_3 \cdot \text{Rating} \cdot \text{Review Count} + \epsilon\) Here, if we see positive coefficient ($\beta_3$), this means impact of review count actually increases as rating increase.
As a result, we observed $\beta_3 = 0.0483$. This implies impact difference of review count when rating is 5, is 66.7% higher compared to when rating is 3. (When rating is 3, 1 additional review may increase 0.1314 views, while it will increase 0.219 views when rating is 5.)
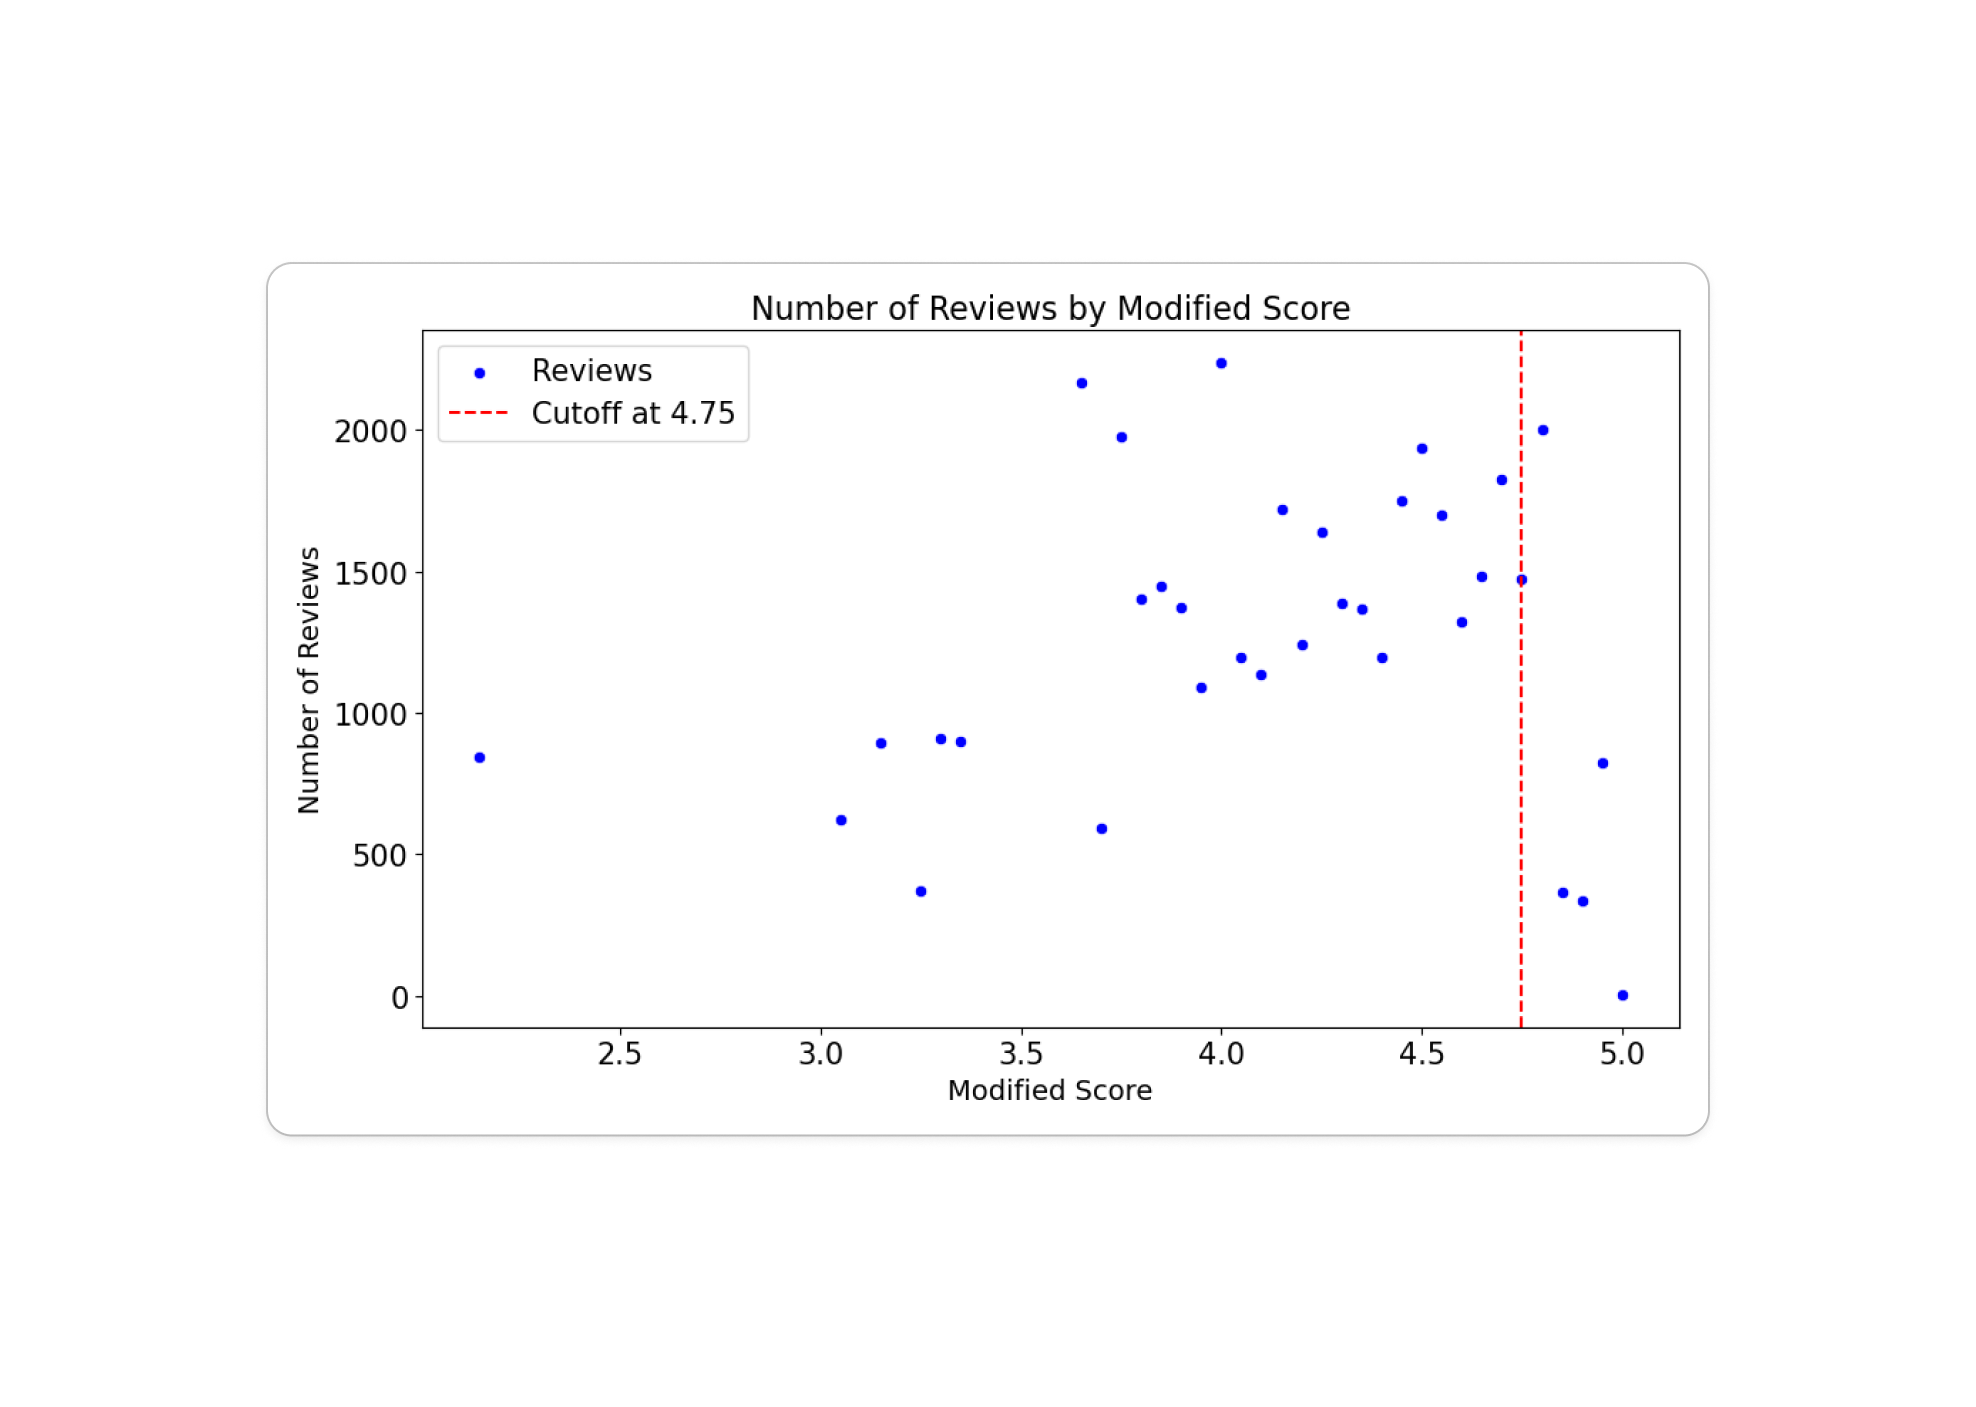
By observing data, we could observe number of ratings dropped significantly after rating 4.75.
Conclusion, and suggestion
There are several takeaways in terms of perception of customers on the rating. We could see that starting from 4.0 displayed score, customers perceive them as ‘significantly high’ score, and start to react more sensitively to the ratings. When rating is 3.5 or lower, customers are less likely to be responsive to the rating. Therefore, it would be important for hotel business to make effort to guarantee 3.75 or higher rating, so they could achieve displayed score of 4.0.
Customers does not seem to differentiate hotels within range of 4.0 to 4.5. Therefore marginal gain of increasing score from 3.5 from 4.0, would be much higher than increasing score from 4.0 to 4.5. If platform (as Tripadvisor) can run promotion or policy to boost quality and rating of hotel business owners, it would be more advantageous to focus on hotels under 4.0 rating.
For hotels high higher rating over 4.75, securing many reviews could be more important than maintaining high reviews. Some business owners may be reluctant to collect more reviews, because it might drop average rating which is already close to perfect. However, from our analysis we could see even average rating is lower, business owners are more likely to get higher view if they secure high number of reviews.